Museum of Natural Sciences

Study on the feasibility of establishing a modern science museum in the «Sevkabel Port» areas. Saint Petersburg 2016.

The cases are chosen based on three criteria:
Closest regionally, like AHHAA in Estonia, which ranks first in the country in terms of attendance, and Heureka in Finland.
Built in the port area of cities like the Nemo in Amsterdam and the Exploratorium in San Francisco.
The main drivers of redevelopment in depressed areas, such as Musea do Amanha in Rio, MUSE in Trento, Techmania in Pilsner.
The International Center for Life was chosen as a good combination of a center with a research institute and a medical institution.
Contents
Basic principles
Large museum networks
National and city associations
Cases
Evaluation methods

Image: Global Goals

Basic principles

The general trend is to move away from entertainment functions to organizing expositions in accordance with the latest UN guidelines/objectives.
Manifest-article.

Each of these goals makes it possible to compare the situation in a particular city (St. Petersburg) or country with the general situation in the world or the situation elsewhere.
This concept is very convenient and implies the possibility for cooperation with as many different institutions and even more so with sponsors.
Heureka, for example, does each exhibition with a specific sponsor.

This concept also leads to thoughts of possible regional cooperation with the foundations of the Arctic Circle and the Nordic countries, as well as a possible exchange of exhibitions with other museums in the Scandinavian region.

The theme of ecology and sharing the sea is central.

Exploratorium, San-Francisco harbour area

Opened by Frank Oppenheimer, the museum set out to change the model of the museum into an educational R&D open laboratory. Today it is a leader in the field of modern museum education. History.

The laboratory is located in the San Francisco harbour and a large part of the exhibition is devoted to research into its industrial development as well as environmental aspects.
All of the research findings are presented using the latest interactive technology, but it is also possible to see the life of the harbour from within the museum building itself. *Observatory

There is a permanent residency for artists and scholars, who create new exhibitions together with museum staff and volunteers. The complete absence of art residencies in St Petersburg cannot be overlooked.

Due to recent re-development of the St Petersburg waterfront and the upcoming changes to Vasilievsky Island, this idea could be very useful, and interested developers could provide subsidies to make it happen.

Port Sevkabel, Vasilievsky Island

Museum of Museums

Interactive interface.

Not only in terms of visitor interaction with the exhibition and the event, but also in terms of how the museum can interact with the city, primarily with other museums in St Petersburg, of which there are about 30 (see sample list), numerous industrial enterprises and commercial companies.

Outsource the best of existing collections, repackage and merge into thematic interactive exhibitions, gaining PR and collaboration, foundations, networks.

In this way, the museum can win the respect of the local population and illuminate all aspects of the city’s industrial development, collecting all the most important inventions and innovations of the past years. Become your own. Memorabilia.
A good example of a museum association – Science Museum Group UK.

ITMO and other educational institutions.

Through thematic grants and commissions to attract the best work and research for temporary exhibitions. Residencies.

A sample list of museums:

Museum of Cosmonautics and Rocket Technology
Central Naval Museum in St. Petersburg
Military Historical Museum of Artillery in St. Petersburg
Museum of the Russian Submarine Forces. Alexander Marinesko
Museum of History of Photography
Museum of Arctic and Antarctic
Museum Universe of Water
Central Museum of Soil Science
Mining Museum
Geological Museum
Metrology Museum at VNIIM
Astronomy Museum
Museum of Electric Transport
Petersburg Underground Museum
Museum of Railway Engineering
Museum of Railway Transport
Museum of phonographs and gramophones.
Central Museum of Communications named after A. Popov. Alexander Popov Museum,
Museum of M.V. Lomonosov
Museum-archive of D.I. Mendeleev at St. Petersburg State University
Museum of Optics
Museum of History of Saint Petersburg
Museum of St. Petersburg
Museum of Telephone History
Museum of Television
Interactive Museum FizLand
Museum LabyrinthUm
The Experimentalium

Play Video

Port Sevkabel, Vasilievsky Island

Large museum networks

Today, there are more than 3,000 Science Centres around the world.
More than 300 million people visit them every year.
25 years ago, only 10% of these organisations existed.

The Association of Science-Technology Centres

Over 650 members from 47 countries, 487 science centres, including not only museums and science centres, but also nature centres, aquaria, planetariums, zoos, botanical gardens, and natural history and children’s museums, as well as companies, consultants and other organisations with a shared interest in informal science education.

Statistics: 2015 Source
Donations from individuals in 2015 increased by 3.7% from the previous year.
Charitable donations by 1.9%, corporate giving by 3.8%,
Grants from foundations increased by a record 6.3%.Sources of operating income (average % of total) 2013-2014 Source 1, Source 2

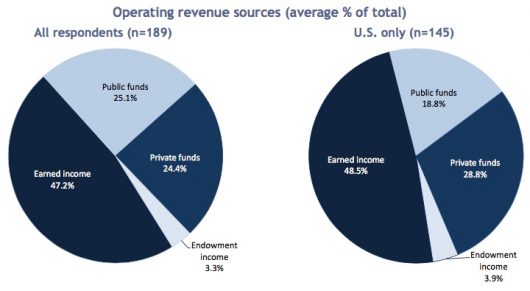
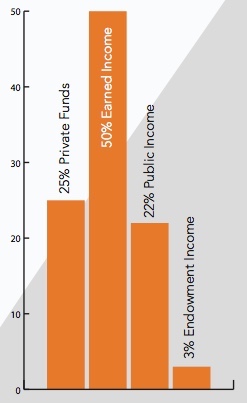
Sources of operating income (average % of total) 2016

Over 120 million visitors in 2016 at ASTS network organisations (over 81 million in 2013).
Average on-site attendance at individual centres was 174,232, with 67% of respondents reporting an increase compared to the previous year.


Local economic development
On average earned income, which comes mainly from ticket sales and programme fees, is the largest source of operating income. Most centres (93.5%) charge admission fees, with adult admission prices ranging from $2.08 to $34.95 ($3.00 to $29.95 in US institutions).
Median fees worldwide are $10.7 for adults, $8.85 for children.

Science centres also bring jobs: 20,594 paid employees to 183 institutions (150 US respondents reported 14,760 paid employees). The average number of salaried employees working on equal terms in individual institutions was 44.5. On average, staff costs account for 56.6% of operating costs.

Public funding represents on average 25% of the institution’s operating income (19% in the United States). Globally, 31.6% of public funds for institutions are subsidised by federal/national governments, 30.5% by states/provinces, 36.8% by local governments and 1.1% by tribal/other public sources. In the United States, the majority (44%) of public funding comes from local government.

The scale of operations varies greatly among science centres and museums, with 10% of respondents reporting running costs of $406,614 or less, and 10% reporting operating costs of over $19.8 million. The median company had operating costs of $3,875,020. The majority of institutions (79%) operated with a balanced budget or surplus in the reporting year.

ASPAC (Asian Pacific)
90 organisations from over 20 countries and administrative regions in Asia and the Pacific, Europe, Central Asia and North America. Science centres and museums, children’s museums, exhibition designers and production companies.

ASTEN Australasian Science and Technology Exhibitors Network
BIG British Interactive Group, STEM Communicators Network.
UK Science Festivals Network
CASC Canadian Association of Science Centres
NAMES North Africa and Middle East Science Centers Network
NCSM National Council of Science Museums India
Red-POP Network for the Popularisation of Science and Technology in Latin America and the Caribbean
SAASTEC Southern African Association for Science and Technology Centres
EGMUS The European Group on Museum Statistics. Collection and publication of comparable statistical data.

National and city associations

The group’s financial results for 2015-2016.

Science Museum Group UK  2015 – 2016                                5,205,000 visitors.

The Science Museum, London                                                   3,219,000 visitors.
The National Science and Media Museum, Bradford                405,000 visitors.
The Museum of Science and Industry, Manchester                  645,000 visitors.
The National Railway Museum, York & Locomotion, Shildon    936,000 visitors.

Board of Trustees of the Science Museum is the corporate body of the Science Museum Group (SMG) and was established under the National Heritage Act 1983. SMG has the status of a non-departmental public body (NDPB), operating within the public sector but at arm’s length from its sponsor department, the Department for Culture, Media and Sport (DCMS).

SMG is an exempt charity under Schedule 3 of the Charities Act 2011, with DCMS acting as its principal regulator for charity law purposes, and is recognised as charitable by HM Revenue & Customs.
SMG has a wholly owned subsidiary trading company, SCMG Enterprises Ltd (company registration no. 2196149), set up in 1988 and operating across all SMG museums.

AmsterdamMusea

48 organisations
13.3 million visitors in 2016
38 million online visitors
19 terraces, 27 cafés, 25 restaurants
2,600 employees and over 900 volunteers

33.1 million visits to museums in the Netherlands in 2015.
Residents visited 23.7 million times.
Tourists 9.3 million.

Source

Cases

Closest regionally, like AHHAA in Estonia, which ranks first in the country in terms of attendance, and Heureka in Finland.
Built in the port area of cities like the Nemo in Amsterdam and the Exploratorium in San Francisco.
The main drivers of redevelopment in depressed areas, such as Musea do Amanha in Rio, MUSE in Trento, Techmania in Pilsner.
The International Center for Life was chosen as a good combination of a center with a research institute and a medical institution.
Data for St. Petersburg
5,200,000 inhabitants in the metropolitan area.
Tourism: 2010- 2017
5.1  – 7 million people
2.3 – 3 million foreigners
 

Nемо

NEMO, Amsterdam, Netherlands, built in 1997
Architect: Renzo Piano

Total floor space 12,000 m²
Exhibitions 5.000 m² on 5 floors
5th most visited museum in the Netherlands
Price of admission: €16.50

Amsterdam: 2,410,960 inhabitants in the metropolitan area.
Tourism: 4.63 million a year, not including 16 million overnight stays a year.

Museum visitors per year:

2016 620.000
2015 588.368
2014 527.883
2013 591.776
2012 545.842

More than 3,000 visitors per day, with an average visit time of 3 hours.

Website NEMO Kennislink 3.2 million visitors a year.
Weekend of Science 150,000 visitors a year.
NEMO Science Museum is part of the non-profit National Centre for Science and Technology.

Generates its own income (from ticket sales, retail operations, venue hire and catering) and is also funded by structural support from the Dutch government and contributions from our partners in academia, the public sector and the business community.

Museumvereniging
VSC (network of science museums and science centres)
OAM (Official museums of Amsterdam)
MOAM (Marketing Association of Amsterdam Museums)
De Plantage Amsterdam (a partnership between sixteen cultural institutions in the eastern part of the city centre)
Stichting Beheer Oosterdok (takes care of the marinas in the area where NEMO is located)

SCWS (World Summit of Science Centres)
ICOM (International Council of Museums)
Ecsite (European Network of Science Centres and Museums)
EUSCEA (European Association of Scientific Events),
Hands On! International (Association of Children’s Museums)
ECSA (European Citizen Science Association).

AHHAA

AHHAA Science Centre, Tartu, Estonia
Built in 2011
Architect: Vilen Künnapu and Ain Padrik

Total floor space 10.000 m²
Exhibitions on 3 floors
No. 1 Estonian museum with a branch in Tallinn. Rivaled by Seaplane Harbour.
Ticket price: € 13

Estonia: 1.3 million inhabitants. Tartu: 93,687 inhabitants.
Tourism: 6 million a year. Tartu 200,000 a year.

Museum visitors a year:
2016 251.729
2015 240.874
2014 281.843
2013 219.259

Average number of full-time employees 66.

Financial data as at 31.12.2016. Source

Net assets €10,151,209
Operating income €2,909,826
Government grants €732,669
Operating expenses €3,519,031
Staff costs €1,265,994

AHHAA Foundation is supported by the Ministry of Science and Education, the City of Tartu, the University of Tartu, the Environmental Investment Centre, Nordea Bank and large companies.

AHHAA is chairing the Nordisk Science Center Forbund (NSCF) and is a member of the board European Network of Science Centres and Museums (ECSITE), European Science Events Association (EUSEA) и International Planetarium Society (IPO).

Heureka

HEUREKA Finland
Built in 1989
Architects: Mikko Heikkinen, Markku Komonen and Lauri Anttila

Total floor space 8,200 m²
Exhibitions 2,500 m²
Average ticket price: €19 – €12.50

Helsinki Metropolitan Area, including Vantaa
Espoo has 1.1 million inhabitants
Vantaa 215.813 inhabitants
Tourism: 3.6 million a year Helsinki (2016)

On average (1989 – 2016) 280,000 visitors to the museum a year.
2016 220.000
2015 228.686
2014 260.000
2013 410.000
2012 270.000

64 permanent staff, 9 temporary and 48 part-time. Financial structure in 2016 Source

Operations
Tickets – €2,175,630 – 24.0%
Rentals – €464,040 – 5.1%
Corporate co-operations – €148,029 – 1.6%
Other income – €643,041 – 7.1%
Export revenues – €116,412 – 1.3%
Other income – €217,929 – 2.4%
Total: €3,765,082 – 41.5%

Funding
City of Vantaa €3,103,035 – 34.2%
Ministry of Education and Culture €2,210,000 – 24.3%
Total: €5,313,035 – 58.5%.

Total funding: €9,078,117 – 100%


Was built in 1989 on a piece of derelict land that became a park. After Heureka was established, the National Forest Council and the Finnish Central Police moved their headquarters here. Major redevelopment has taken place in the area, with new housing and office projects. This is continuing.
Heureka’s facilities and property are owned by the real estate company Kiinteistö Oy Tiedepuisto, whose shares belong exclusively to the city of Vantaa.

For Heureka in 2012, the calculator estimates the main economic impact of €17.9 M in the Helsinki metropolitan area.
Budget of about €10 M, annual visits of 300 000, population of metropolitan area of 1 million.
Government subsidies of €5.5 M. Museum visitors spend on average €49.40 per visit (Piekkola et al. (2013).
Thus, Heureka’s direct impact is €14.8 million.

The founders of the foundation are the University of Helsinki, Helsinki University of Technology, Federation of Finnish Learning Societies, and Confederation of Industries.
The Finnish Science Centre Foundation:
Aalto University, Central Organisation of Finnish Trade Unions, City of Vantaa, Confederation of Finnish Industries, EK, Federation of Finnish Learning Societies, Ministry of Education and Culture, Ministry of Employment and the Economy, Ministry of Finance, Trade Union of Education in Finland, University of Helsinki

Exploratorium

Exploratorium, San Francisco, USA
Built in 2013
Architects: EHDD

Total floor space 20,000 m²
Exhibitions 7,000 m² 7000
Average ticket price: €17 – €25

San Francisco has 865,000 inhabitants.
Tourism: 25.1 million (2016)

Museum visitors per year: 2016 – 854,325
Budget 2017 –  €40.6 million
326 permanent staff, 150 temporary and part-time.

Private contributions $16.5 million ( $16.2 million in 2014 )
Government grants $5.2 million ( $4.8 million in 2014 )
Global Studios $5.3 million
Tickets $9.5 million
Membership $2.5 million
Rent $6.2 million
In-store sales $2.2 million
Operating income $44.6 million ( $48.5 in 2014 )

Program Services:
Programs for visitors, students and teachers $33.6 million ( $25.4 in 2014 )
Global Studios $10.7 million ( $6.3 in 2014 )
Visitors and other $1.5 million ( $2.7 in 2014 )
Shop expenses $1.4 million ( $2.4 in 2014 )

Office
General and Administrative $4.5 million ( $6.8 in 2014 )
Fundraising and Membership $3.9 million ( $4.4 in 2014 )
Operating expenses $56 million ( $48.1 in 2014 )

Source

Founded in 1969 by Frank Oppenheimer.
World leader in innovation in education throughout the centre’s history. 80% of the world’s science centres use exhibitions, programmes and ideas developed by the Centre.
200 million people visit exhibitions and experience the Exploratorium.

12 million visits on the website www.exploratorium.edu with 50,000 page content views.
More than 3.5 million monthly social media reach.
Over 1,000 teachers participate in the Teachers Institute programme each year. Four artist residencies a year.

Foundations supporting the centre: National Science Foundation, National Institutes of Health, National Endowment for the Arts, NASA, Grants for the Arts/San Francisco Hotel Tax Fund, San Francisco Dept. of Children, Youth and Their Families, California State Coastal Conservancy and many other foundations, corporations and individuals.

MUSE

MUSE, Trento, Italy

An opportunity came along with the planned urban redevelopment to move to a post-industrial district on the outskirts of the city.
This new neighbourhood needed a cultural ‘soul’, the residents convinced our mayor that it should be a museum that shows our collections in a new light, telling a modern story about the mountain environment.

The museum (building + exhibition design) cost 70 million euros.
The province owns the building and provide the capital investment – MUSE is the tenant.

1,061,041 visitors
44,196 Facebook followers
5,000 Teachers Club Registrations

Annual operating budget of €9.8 million (of which almost 50% is own income).
Visitor figures increased by 20% in the second year due to school visits.

Read interview: Would you rather set up your science centre in the new Renzo Piano building or in the converted Skoda factory?
A conversation with the directors of MUSE and Techmania.
Architecture and museography: a MUSE-Techmania double interview

Techmania

Techmania, Pilsen, Czech Republic
The former Skoda locomotive construction workshop 10,000 m2.

“The history of the vehicle manufacturer Skoda is linked to the history of our city.
In 2005-2006 Skoda began to recover from the post-Soviet transition and once again played an important economic role in the region. They wanted to have a positive impact on the city. So in 2006 the idea arose to create a technology museum, drawing on the region’s rich industrial past.

Just a technical museum wasn’t a bright enough idea; we wanted something more edgy, so the first science centre in the Czech Republic came into being.

The location of our building in an industrial area is an advantage for us. It has a 100-year history and even the building that houses our new 3D planetarium is a national treasure.

At the beginning we had no reliable money and little hope for the future: we were given a budget for the year.
In the first phase from 2006 to 2008 we redeveloped a third of the building donated by Skoda for a total of € 4 million.

In 2010, the Ministry of Science and Education launched a nationwide science centre programme with EU funds.
We received €22 million which, combined with the municipality and private funding, enabled us to complete our programme. Last year we had 200,000 visitors (in a city of 170,000 people).

Read interview: Would you prefer to set up the Science Centre in the new Renzo Piano building or in the converted Skoda factory?
A conversation with the directors of MUSE and Techmania.
Architecture and museography: a MUSE-Techmania double interview

Museu do Almanha

Museu do Almanha, Rio de Janeiro, Brazil.
Opened in December 2015

Located in Praça Mauá (Maua Square) in Rio’s impoverished port, the $100 million museum was designed by Spanish architect Santiago Calatrava as part of an extensive regeneration of a depressed area.

Known as the Porto Maravilha project, the £2bn (€1.7m, €1.8m) urban regeneration strategy aims to sustainably reintegrate the area with the rest of the city by developing better passenger transport, accommodation, culture and recreation, ultimately increasing the local population from 28,000 to 100,000 by 2020.

For Eduardo Paes, mayor of Rio, the museum has set an example for the city. “The Museum of Tomorrow is a symbol of the redevelopment of Rio’s important port and, since its construction, has inspired our hopes for the city to become more integrated and more generous with public spaces.”
The museum cost around $100 million (€88 million) and was funded by the City of Rio de Janeiro, the Roberto Marinho Foundation, and Banco Santander, the main sponsor.
BG Brasil, as chaperone, provides around $864,000 ( €756,000) a year and is also supported by the State of Rio de Janeiro.

“We receive funds from the city government and our goal is to provide 50% public funding and 50% through corporate funding, individual giving, membership and private events.
We have reached 300,000 visitors in less than 100 days.
At this point we will probably have 1 million people in the first year.” Source

International Centre for Life

International Centre for Life, Newcastle-upon-Tyne, England, United Kingdom.
Was built largely with public funds, but has earned 100% of its operating income since it opened in 2000.

Life is a “science village” located in the heart of the city, bringing together some 600 researchers, medical professionals, business people, education professionals and ethicists from 35 countries.

The Institute of Genetic Medicine at Newcastle University, as well as two National Health Service clinics that treat patients with fertility problems and genetically inherited conditions.

Although the university and clinics do pay rent, we do not charge them a commercial rent because they are an integral part of the concept and also bring goodwill and trust. Their main focus is regenerative medicine – the world’s first cloned human embryo was created in Life, although the research centre covers all aspects of science, technology, engineering and mathematics (STEM).

Only 25% of our operating income comes from core activities. The rest comes from a range of revenue sources, including rent. We rent open space for popular events such as beer festivals, concerts and so on, as well as organising conferences and events, a car park (garage), the usual café and shop and an outdoor ice rink during the winter months.

To add extra spice to the mix, we are home to the most popular nightclubs and three bars.
The success of life has to do with bringing bands and events together that don’t usually exist in one place – and they can also bring in money for a place to grow.

The model is both rewarding and challenging.
Not all academics enjoy working together with a fun factory for kids, nightclubs and music events, although I’m happy to say that most do. We have built very close relationships with academics locally and are involved in numerous collaborative projects with them. The clinics tell us that patients prefer to come to a friendly environment at Life for treatment rather than go to the hospital. Source

Other examples

The best example of urban renewal is Calcutta’s Science City of Kolkata.
It was built on the city’s rubbish dump.
Today it is a vibrant place, attracting more than 1.5 million visitors a year.

Techniquest was the first cultural institution in the development of Cardiff Harbour, now hosting the Welsh National Opera.

Citta della Scienza opened up the development of an abandoned industrial zone in Naples.

The first cultural institution in the redevelopment of Baltimore’s Inner Harbour was Maryland Science Center.

Evaluation methods

Pressure on public finances has meant significant cuts to government funding for museums in many European countries. It is therefore more important than ever that museums are able to demonstrate and communicate the wider benefits that they bring to economies and societies to a range of funders and stakeholders. But what should museums focus on and what kinds of methods and studies can be used?
This paper suggests how museums can navigate their way through the various options, highlighting the pros and cons of different methods, and how suitable they might be to different contexts.

There are a large variety of methods to measure the value of museums. Some are moreappropriate,somelessso,depending on what you want to measure and on the nature of the museum. You have to take care that the results don’t box you into a sector in which you don’t want to be measured by your stakeholders and politicians.

Why measure the economic impact of museums? There are outward rationales: communicating your values to the public, stakeholders, politicians, press – but also inward rationales that affect strategic decisions in your organisation on how to organise processes and what to put emphasis on. The research methods and techniques can be confusing for non- specialists in this field. There are, broadly speaking, three different lenses though which you can look at economic impact:

1. Financial impact

There is a range of methods quantifying and measuring different expenditure streams (staff costs etc.), and looking at the indirect and induced impacts of these. If you use these for museums, you will end up with a small number, even for large organisations, because museums are quite small in terms of turnover compared to other organisations. You will never produce a headline-grabbing number to funders. But museums attract lots of visitors, so in addition you can measure what is spent by museum visitors in the surrounding economy, in accommodation, restaurants and shops (it can be difficult, however, to work out what is genuinely additional spending that was incurred only by the museum visit). An approach that combines the two methods described above is the most commonly used one. But there are other methods:

2. Place-based impact assessment

Assessing how the city or surrounding area is impacted by the museum. This is often connected to the theme of (urban and rural) regeneration. There are many positive consequences to having a museum, such as improving the image of a city, driving footfall and generating a sense of liveliness. Positive benefits that flow from these can be higher rental yields for neighbouring properties, more shops and greater takings, more jobs, reduced crime and greater safety. Results like these are interesting to local government funders, but this is the least used of all methods, because the ndicators are less clear and straightforward and it also requires longitudinal research overalongperiodoftime.Regenerationis a long-term business that can take 15 to 20 years or more; in the interim there are few immediate outcomes and conclusions.

3. The total value approach

This encompasses methods that try to put a financial value on things that don’t have a ready financial value, such as wellbeing, learning, cultural enrichment and even the value non-users place on having a museum in their town or city. It explicitly tries to quantify, for example, social and learning benefits. Both the cost-benefit approach and the total economic value approach try to demonstrate that final monetary value is an exchange between the costs incurred and the benefits obtained. These could include non-used values, like the value of the existence of a museum (i.e. people just value having the museum in their neighbourhood; even if they don’t go themselves, they value the fact that others can visit it or they may hold the view that they will go in the future, when they have a family for instance).

Total economic value approach

You can work with revealed or stated preference methods; one positive aspect is that government economists are familiar with these methods because they are used in other policy areas, particularly those that look at non-market goods such as environment. But this approach is extremely demanding in its technique. It requires highly skilled researchers, large- scale primary research and multiple cohorts of users and non-users. Outcomes of the research can also be quite abstract, as the final output is often just one big figure split between use value and non-use value, and it is not possible to know what has actuallygeneratedthesefigures(e.g.which of the museum’s services in particular, for example, do people value?). Frequently, the non-used value is the biggest value (because there are more non-users than users), but this can create PR problems, because it is hard to advocate that a museum is valued the most by people who don’t visit it. For all these reasons, this method is very rarely used in museums; there are more examples of this method being applied to libraries and heritage sites.

Financial impact method

There are both existential and technical reasons as to why you might not want to use the financial impact approach. If the museum is interested in valuing what local people get from the museum, this is not the right method. It works best if the museum gets lots of external visitors and most of them are tourist visitings, because it is this group that spends more in the local economy as part of the visit and this spending is also more likely to be genuinely additional expenditure.

Socially adjusted cost-benefit analysis

Social Return on Investment (SROI), is a form of socially adjusted cost-benefit analysis. This method is quite popular in the charity and voluntary sector. It helps museums understand what their stakeholders and community value about them and how they think the museum has a social impact.
The method then requires an identification of which of these values are quantifiable, which are the most important, and what the financial proxies are that can be used to estimate these (social) values and impacts. For charities, museums and the wider cultural sector, much of the social value they create is generated through helping to forgo expenditure on the social costs of ‘failure’. That is, if a museum can positively affect people dealing with mental health issues or unemployment etc., then money that the state would otherwise spend(e.g.unemploymentbenefit)canbe avoided if, for example, a participant in a museum programme is able to find a new job through the programme. This method requires a combination of primary data collection and user analysis, plus analysis of secondary data, which establishes proxies and measures how the positive change that has happened to the user can be attributed to your particular museum (and not, for example, to social services or the theatre or anything else that helped the user feel better). Again, extensive research is required.

Broadly speaking, this technique is much more effective when there is a very clear intended outcome. However, this is not the reality for most museums, because they have a much broader offer that is aimed at the general public. Therefore, this method is best applied in museums to measure the value of participatory programmes targeting specific groups.

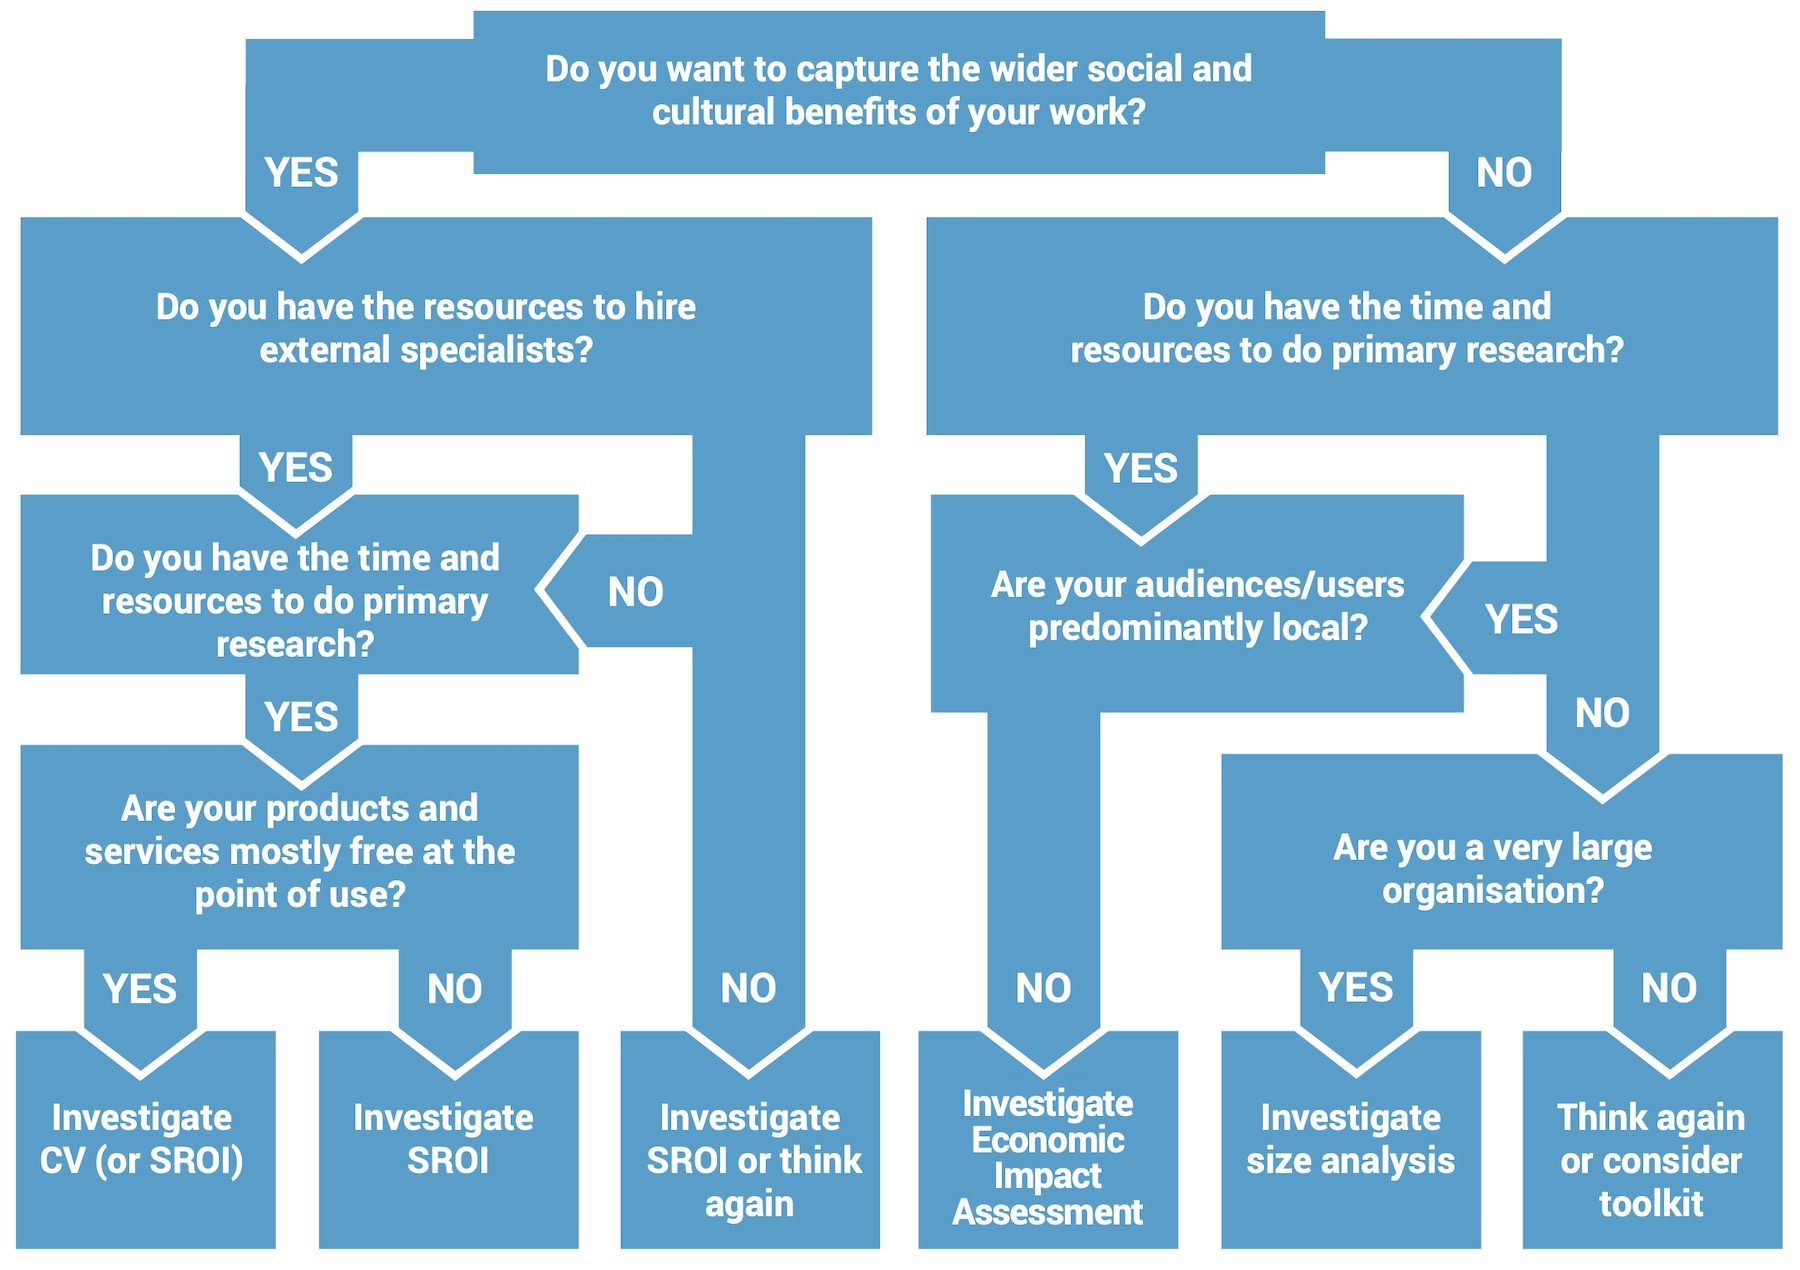
How do you decide what method applies best to your museum?

There are two main dimensions to the decision: strategic and operational. Strategically, a museum needs to know what it wants out of the study but also has to balance this against what it knows its main funders and stakeholders would want and the kind of evidence they would like to see. Operationally, a museum needs to consider what can best be achieved in terms of research quality and comprehensiveness, balanced against the inevitably limited time and resources that will be available to conduct the research.

Measuring the value of museums: options, tips and benefits.

Richard Naylor article from
Money Matters:
The Economic Value of Museums
Network of European Museum Organisations Conference 2016.

Port Sevkabel, Vasilievsky Island

Scroll up